Overview
The Executive Metrics page provides security leaders, managers and executives a simple way to compare a broad set of best practice vulnerability management metrics across asset groups. This article provides an overview on using the Executive Metrics page and a reference section describing each of the available metrics.
Usage
Selecting Executive Metrics, located under Assets in the left-menu, takes you to default view of performance metrics for All Assets:
.png "image(354).png")
Selecting Asset Groups
Use the Select Groups panel to select one or more asset groups to compare metrics for, then click Apply:
.png "image(355).png")
Each selected (checked) group will appear as a row in the Performance Metrics table on the right.
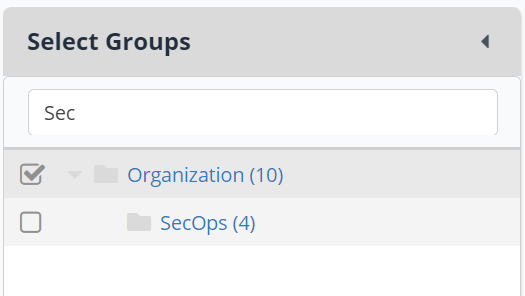
The Search box allows you to filter the displayed Asset Groups by entering a search string and pressing Enter:
Selecting Metrics
Several common metrics are selected by default when opening the Executive Metrics page. To customize which metrics are displayed in the Performance Metrics table:
Click the Select Metrics button:
.png "image(356).png")
At the top are quick links to Clear Selections or Reset to Default selections.
After selecting which metrics to display, along with sub-options like severities to include and/or prior timeframe, click the Save button to apply your changes.
Performance Metrics Table Interactions
Selected Metrics appear as columns in the Performance Metrics table. The following capabilities allow you to further analyze can compare metrics across asset groups:
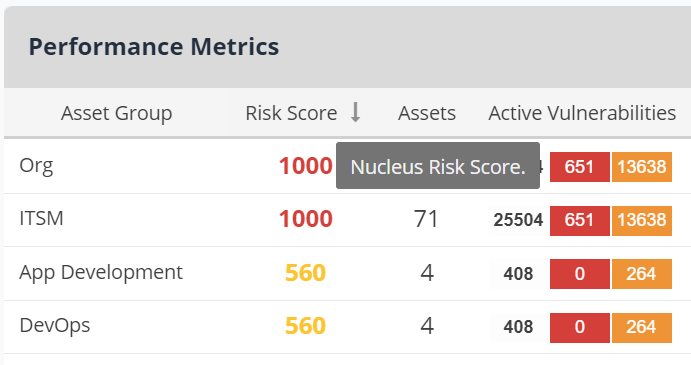
Sort by a given metric by single clicking the center area of column headers:
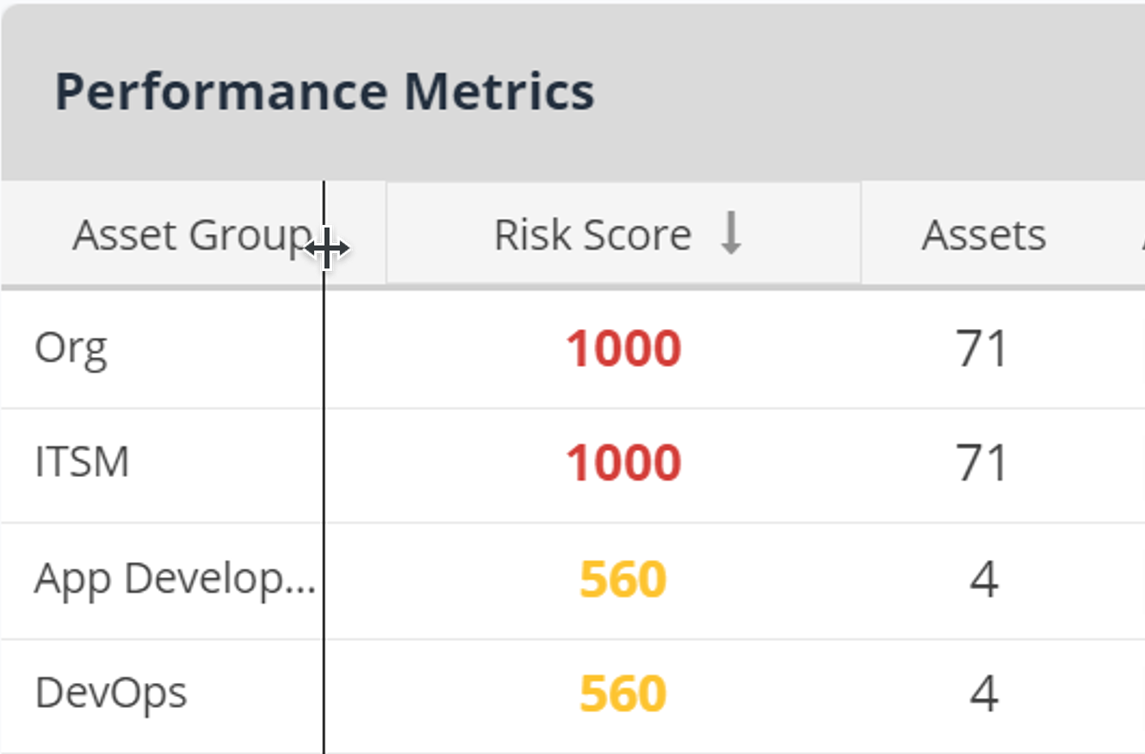
Resize columns by dragging the right edge of the column's, header:
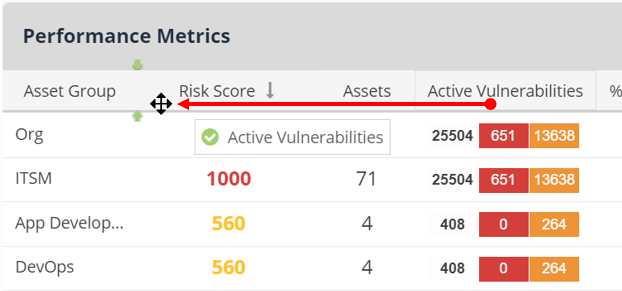
Reorder columns by dragging the center area of column headers:
Freeze Columns:
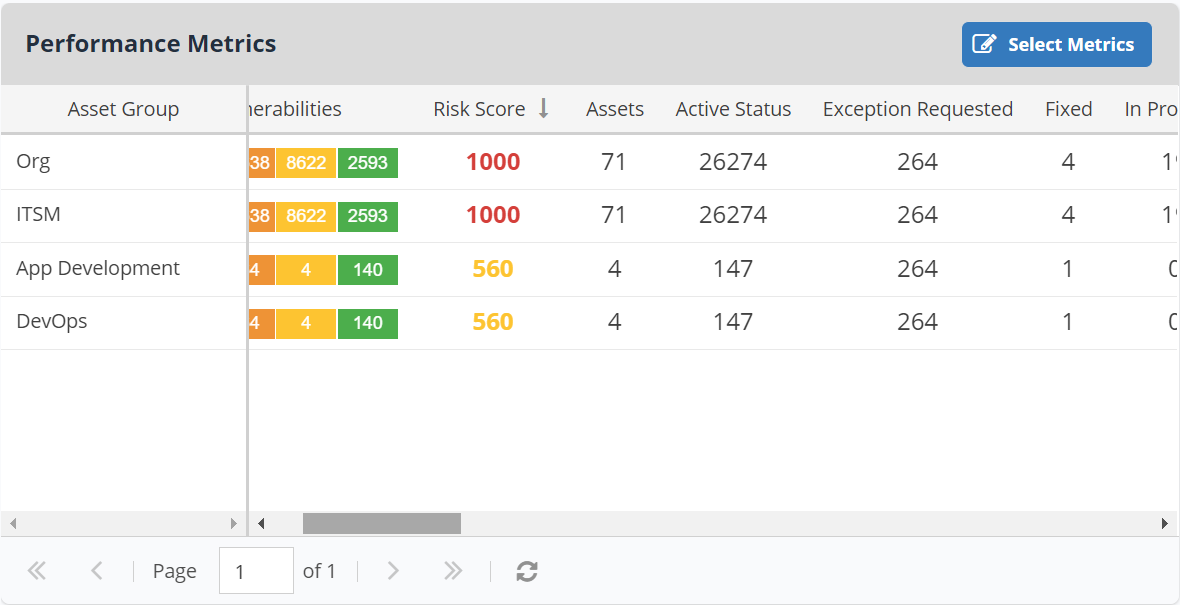
The Asset Group column is Frozen by default, allowing you scroll horizontally through many metrics without losing context of which asset groups you are comparing:
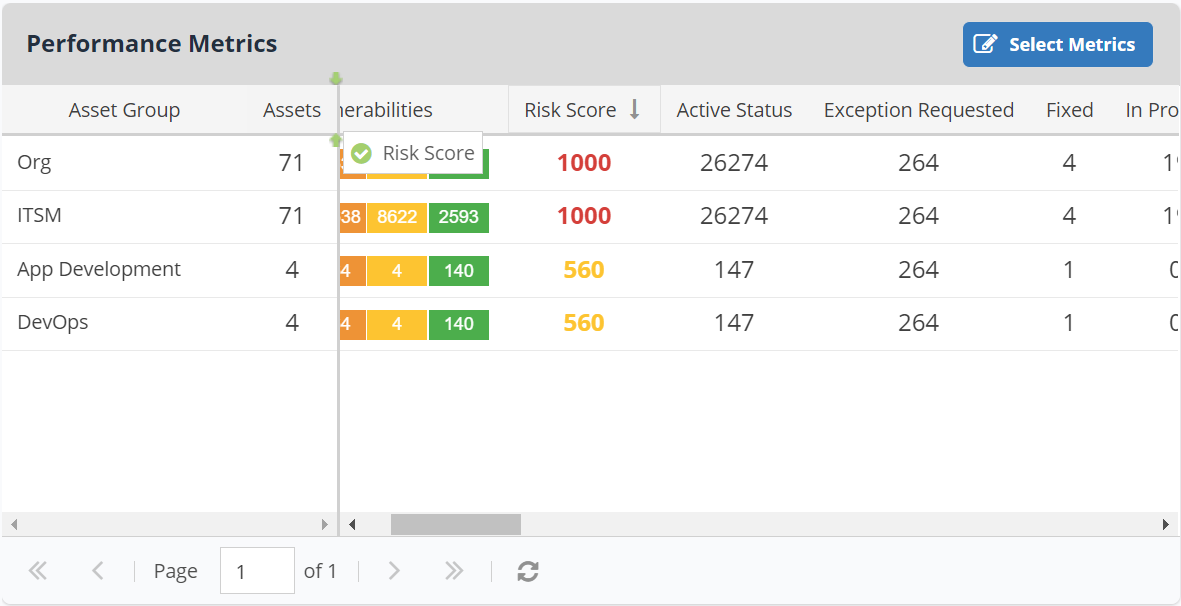
You can freeze additional columns by dragging them into the left of the freeze columns:
Saving Views
Saved Views provide the ability to save different combinations of asset group and metrics selections for specific use cases like comparing team performance against SLA metrics or comparing risk and threat intelligence metrics across asset categories.
To save a view:
After making the modifications you wish to save (asset group selections, metrics selections, sorting, column order, etc.), click the Save View button in the header of the Performance Metrics table:
.png "image(357).png")
Enter a unique View Name (required), optionally you can provide a description for the view, then click Save:
.png "image(358).png")
Your saved view is now available for quick access in the future under the Saved Views dropdown:
.png "image(359).png")
To modify a Saved View:
Open the Saved View you wish to modify.
Make desired changes such as asset group selections, metric selections, etc.
Click the dropdown arrow next to Save View, then select Save Changes:
.png "image(360).png")
To modify the Name and Description of a Saved View:
Click the view selector dropdown, then click the Edit button next to the Save View you wish to update:
.png "image(361).png")
Update the Name and/or Description, then click Save:
.png "image(362).png")
To delete a Saved View:
Click the view selector dropdown, then click the Delete button next to the Save View you wish to delete:
.png "image(363).png")
When prompted, click Delete to confirm deletion of the saved view, or click Cancel to return.
Metrics Reference
The following table provides a reference for available metrics along with a description for how each is calculated.
Key Things to Know
Instance-level metrics: All metrics on this page are calculated at the instance level → ach asset-vulnerability combination counts separately. For example, if CVE-2024-1234 exists on 10 servers, it counts as 10 instances.
Active assets only: Metrics are calculated on active assets only; inactive assets are excluded.
Informational severity excluded: Unless otherwise specified, vulnerabilities with a severity of Informational are not included.
NOTE: Unless otherwise specified, vulnerabilities with a severity of Informational are not included when calculating metrics.
Category | Metric | Description |
|---|---|---|
Vulnerabilities | Active Vulnerabilities by Severity | Count of active vulnerability instances by severity. |
Vulnerabilities | Active Vulnerabilities by Status | Count of active vulnerability instances by status (Active, Exception Requested, In Progress, etc.) |
Vulnerabilities | Average Age of Active Vulnerabilities by Severity | Average number of days from Discovered Date until today for active vulnerability instances by severity. |
Vulnerabilities | Discovered in Last {#} Days by Severity | Count of vulnerability instances with a Discovered Date within the last {#} days by severity. |
Vulnerabilities | Resolved in Last {#} Days by Severity | Count of vulnerability instances remediated in the last {#} days by severity. |
Vulnerabilities | % Churn in the Last {#} Days by Severity | Ratio of discovered vs. resolved vulnerability instances in the last {#} days by severity. This provides the ability to track whether or not your remediation velocity is keeping pace with rate at which new vulnerabilities are being discovered. |
SLAs & Remediation | % Past Due Vulnerabilities by Severity | Percent of active vulnerability instances past their due date by severity. |
SLAs & Remediation | Past Due Vulnerabilities by Severity | Count of active vulnerability instances with due dates in the past by severity. |
SLAs & Remediation | % Active Within SLA by Severity | Percent of active vulnerability instances not past their due date. |
SLAs & Remediation | % Resolved Past SLA in Last {#} Days by Severity | Percent of vulnerability instances resolved past their due date for the last {#} days by severity. |
SLAs & Remediation | Resolved Past SLA in Last {#} Days by Severity | Count of vulnerability instances resolved past their due date for last {#} days by severity. |
SLAs & Remediation | % Resolved Within SLA in Last {#} Days by Severity | Percent of vulnerability instances resolved on or before their due date for the last {#} days by severity. |
SLAs & Remediation | Resolved Within SLA in Last {#} Days by Severity | Count of vulnerability instances resolved on or before their due date for last {#} days by severity. |
SLAs & Remediation | Active Vulnerabilities with no SLA by Severity | Count of active vulnerability instances without a set due date by severity. |
SLAs & Remediation | MTTR for Vulnerabilities Resolved in Last {#} Days by Severity | Average number of days from Discovered Date to Remediated Date for vulnerability instances resolved in the last {#} days by severity. |
SLAs & Remediation | Resolved in Last {#} Days by Status | Number of vulnerability instances resolved as {Status} in the last {#} days. |
Risk & Threat Intelligence | Risk Score | Nucleus Risk Score for the asset group. |
Risk & Threat Intelligence | Nucleus Threat Rating | Count of active vulnerability instances by Nucleus Threat Rating (Existential, Critical, High, Medium, Low). |
Risk & Threat Intelligence | Nucleus Zero Day by Severity | Count of active zero-day vulnerability instances based on Nucleus Insights threat intelligence data by severity. |
Risk & Threat Intelligence | Nucleus Known Exploited by Severity | Count of active vulnerability instances known to be actively exploited based on Nucleus Insights threat intelligence data by severity. |
Risk & Threat Intelligence | Nucleus Widely Exploited by Severity | Count of active vulnerability instances known to be widely exploited based on Nucleus Insights threat intelligence data by severity. |
Risk & Threat Intelligence | Nucleus Exploited by Malware by Severity | Count of active vulnerability instances with known malware exploits based on Nucleus Insights threat intelligence data by severity. |
Risk & Threat Intelligence | Nucleus Exploit Available by Severity | Count of active vulnerability instances with a publicly available exploit based on Nucleus Insights threat intelligence data by severity. |
Risk & Threat Intelligence | Nucleus Impacts OT by Severity | Count of active vulnerability instances that impact operational technology (OT) based on Nucleus Insights threat intelligence data by severity. |
Risk & Threat Intelligence | Nucleus Likely to be Exploited by Severity | Count of active vulnerability instances predicted to be exploited based on Nucleus Insights threat intelligence data by severity. |
Compliance | Compliance Pass % | Percent of compliance finding instances with a result of Passed or Warning. |
Compliance | Compliance Passes | Number of active compliance finding instances with a result of Passed or Warning. |
Assets | Number of Assets | Count of active assets in an asset group. |
Ticketing | Open Tickets | Count of open tickets created in external ticketing systems. |
Ticketing | Tickets Created in the Last {#} Days | Count of external tickets created in the last {#} days. |
Ticketing | Tickets Closed in the Last {#} Days | Count of external tickets closed in the last {#} days. |
Ticketing | % Past Due Vulnerabilities Without Tickets by Severity | Percent of active vulnerability instances past due without tickets created by severity. |
Ticketing | % Vulnerabilities Without Tickets by Severity | Percent of active vulnerability instances without tickets created by severity. |
Executive Metrics vs. Trends Page
You may notice differences between counts on the Executive Metrics page and similar metrics on the Trends page. This is by design—each serves a different purpose:
Executive Metrics | Trends Page | |
|---|---|---|
Counting method | Instance-level only | Unique and Instance views available |
Asset scope | Active assets only | All assets (including inactive) |
Discovered counts | Based on original discovery date | Includes rediscoveries |
Executive Metrics is optimized for point-in-time program measurement across asset groups. Trends is optimized for operational visibility over time.